
Supercomputers gobble up tens of billions of clues to predict the path of a hurricane, everything from the smallest raindrop to the most raucous thunderstorm, temperatures from the sea’s surface to the underbelly of space and the directions of light breezes to gale force winds.
The data is crunched and a “spaghetti” model is produced.

A decade of over-achieving storms have made the models water cooler fodder; is the Euro better than the American? What’s that one rogue line mean?
Hurricane experts say divining the spaghetti models is best left to the National Hurricane Center whose meteorologists are trained to know their biases, strengths and weaknesses.
Because each colorful squiggle can carry the weight of the forecast, or mean very little.
“I’d simply recommend that people don’t look at them,” said Brian McNoldy, a senior research associate and hurricane expert at the University of Miami Rosenstiel School. “There are all those four-letter acronyms and if you don’t know what those are, you probably shouldn’t be trying to interpret it.”
But the Internet has made spaghetti models ubiquitous. Social media is cluttered with them. They’re nearly unavoidable. So, knowing some basics may be helpful.
What are spaghetti models?
Spaghetti models make predictions based on atmospheric evidence gathered from a myriad of sources including satellites, ocean buoys, ships, Hurricane Hunters and weather balloons.
Global models including the popular Euro (ECMWF) and the American model, which is also called the Global Forecast System, or GFS, run year round for the entire Earth putting out information every six hours for forecasts from Antartica to the Greenland Sea and beyond.
Track all active storms
Regional models, including the Hurricane Weather Research and Forecast System’s (HWRF) and the Hurricane Multi-scale Ocean-coupled Non-hydrostatic model (HMON) are turned on when a tropical disturbance is designated an Invest by the National Hurricane Center. These have more detail than the global models.
How should we interpret spaghetti models?
The two main types of models are the deterministic and ensemble.
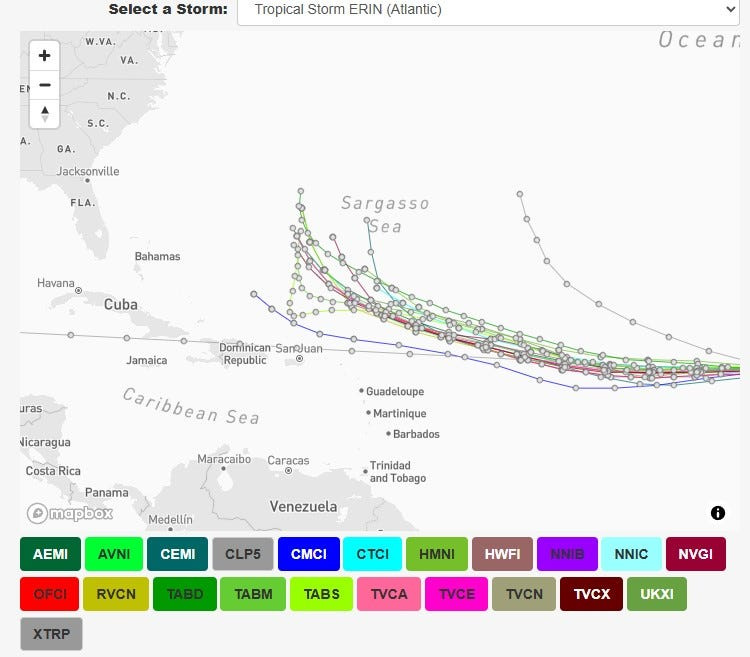
Deterministic models are individual forecasts of each of the model types. They are single runs of a specific model and typically displayed on graphics with four-letter acronyms accompanying each line. The graphics can also include the mean of an ensemble run of a specific model.
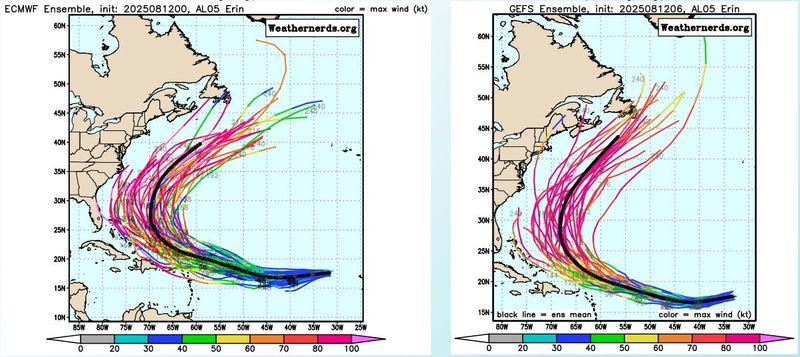
Ensemble models take each single forecast run of an individual model, such as the GFS, and then tweak the initial information fed into the model. That can mean making tiny changes in location, moisture or winds, to get an array of outcomes. These are displayed on maps as between 20 and 50 lines depending on the model.
James Franklin, former branch chief of the Hurricane Specialist Unit at the National Hurricane Center, said it’s important to focus on the clustering of the lines in the models and not the outlier lines.
“The clustering is telling you what the odds favor,” he said. “I hope people won’t get hung up on one or two tracks coming to Florida, which is within the realm of possibility but not the most likely outcome.”
On Monday, Aug. 11, a run of the GFS ensemble for Tropical Storm Erin showed two lines hitting at or very near Palm Beach County and one strafing the western Keys. By Tuesday, Aug. 12, those lines had moved farther east and were no longer reaching Florida. That could change again as the storm gets closer.
Weather alerts via text: Sign up to get updates about current storms and weather events by location
There are also models that don’t consider what is happening in the atmosphere at all. The CLP5 model bases its forecast on what similar storms have done in the past. The XTRP is a straight line that extends the storm’s recent motion out five days.
“The main message here is that it’s hurricane season and if there’s something you meant to do in terms of getting supplies or preparing, do it,” Franklin said.
Who produces spaghetti models?
Multiple government agencies, universities and private companies produce spaghetti models. Not all represented on every graphic depending on licensing and data access.
Some of the more prominent models include:
“There is no best model to always look at,” McNoldy said. “If it were that simple, it would be great, but from one case to the next you don’t know which model will be the most skillful.”
Why do they differ, and at times wildly so?
Models are configured differently based on the different data inputs and have different strengths and weaknesses.
McNoldy said there was a time when the Canadian model was mostly disregarded by forecasters but has since gained some skill.
“It used to be a joke, but I think people do look at it now. You don’t generally give it as much weight as the Euro or American model,” he said.
Ensemble models can show many different outcomes depending on the tweaks made to the initial information. The further out a model goes, the less accurate it is.
“The models are run out further than they can be trusted,” McNoldy said.
While the hurricane center does a five-day forecast, some models extend out to 16 days. Franklin referred to it as the butterfly effect, where a tiny change in the initial information can make a huge difference 10 days to two weeks into the forecast.
What is the black line at the center and is that the track the storm will take?
In the ensemble models, the black line is the mean of all the runs in that model. The GFS, for example, has 20 independent runs that have had different information put in at the beginning of the forecast period. The Euro model has 50 ensemble runs.
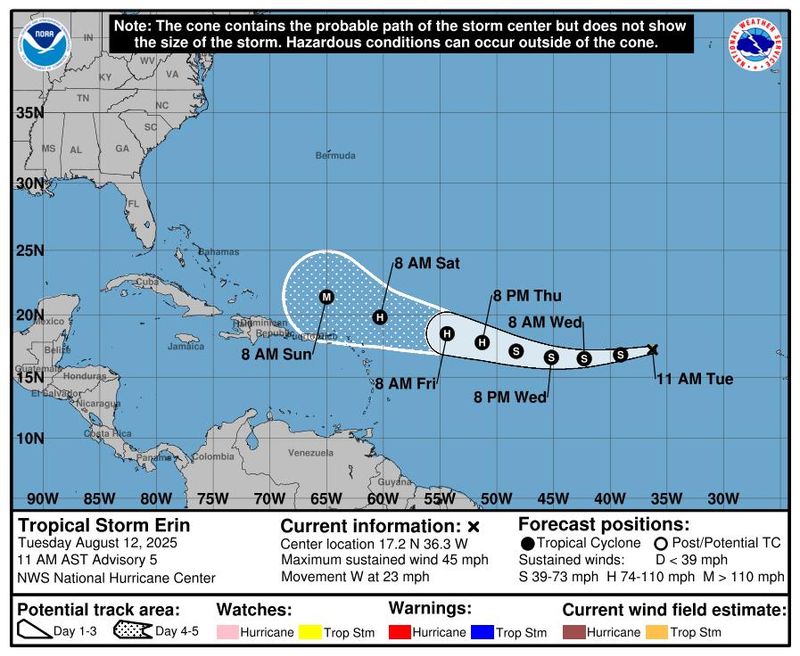
There is no guarantee a storm will track along the center black line, just like there is no guarantee that a storm will stay within the National Hurricane Center’s cone of uncertainty. The cone is drawn based on the past five years’ forecasts so that the storm will stay inside of it an estimated 66% of the time.
How do meteorologists use spaghetti models?
Meteorologists use spaghetti models to help assess the certainty that a storm will track a certain way. A tight cluster of lines can mean there is more confidence in a storm’s path.
The spaghetti models help National Hurricane Center forecasters draw the forecast track cone of a storm. Forecasters try to avoid drastic changes in incremental track forecasts, something they refer to as the “windshield wiper effect.” A single run of a model may show significant a change, but the next model run may show a more subtle change.
“We don’t all have to be experts at everything,” said McNoldy about interpreting the spaghetti models. “There are people we pay to do things that we don’t know how to do.”
Kimberly Miller is a journalist for The Palm Beach Post, part of the USA Today Network of Florida. She covers real estate, weather, and the environment. Subscribe to The Dirt for a weekly real estate roundup. If you have news tips, please send them to kmiller@pbpost.com. Help support our local journalism, subscribe today.
This article originally appeared on Palm Beach Post: Hurricane season 2025: How to read the spaghetti models that are all over social media
Reporting by Kimberly Miller, Palm Beach Post / Palm Beach Post
USA TODAY Network via Reuters Connect