

The Mohawk Valley saw a 4% decrease in jobs between 2010 and 2025 while most regions in New York experienced job increases.
Fewer Mohawk Valley adults had graduated from college in 2024 than in any other of the state’s 10 regions, except the North Country.

And the Mohawk Valley tied with the Southern Tier in 2024 for having the highest percentage of residents age 65 or older.
Those statistics all come from a recently released data dashboard, “Competitive NYS: Value Proposition Tracker,” by the nonprofit, nonpartisan think tank Citizens Budget Commission. It contains state, regional and county data on population, the economy, taxes, public spending and education over time to highlight regional variations — where the state is thriving and where it’s falling behind.
“How well New York attracts and retains residents and business— its competitiveness — drives growth, opportunity and quality of life for all New Yorkers,” said commission President Andrew Rein, in a statement. “Knowledge is power and Competitive NYS is a user-friendly tool to help New Yorkers understand the state’s strengths and challenges, and join the fight for its best future.”
Defining the Mohawk Valley
Many of the report’s statistics for the Mohawk Valley back the commission’s assertion. Much of the state faces challenges less prevalent in the state’s “growth corridor” from Long Island, through New York City and the Hudson Valley, and up to the Capital Region or, to some extent, in counties with larger cities including Syracuse, Rochester and Buffalo.
Competitive NYS defines the Mohawk Valley as Oneida, Herkimer, Otsego, Fulton, Montgomery and Schoharie counties.
The report’s overview of long-term demographic and economic data on challenges in some upstate regions, including the Mohawk Valley, is valuable, said Marc Barraco, chief of staff of Mohawk Valley EDGE.
But to some extent, it’s already old news, he argued.
“It is important to recognize that economic development outcomes often lag behind the investments that drive them,” he said. “Many projects now coming online in the Mohawk Valley will take several years before their full impact appears in population, employment, income and tax base statistics.”
“If these projects perform as expected, the region’s economic indicators could look substantially different five years from now than they do today.”
The Mohawk Valley overall
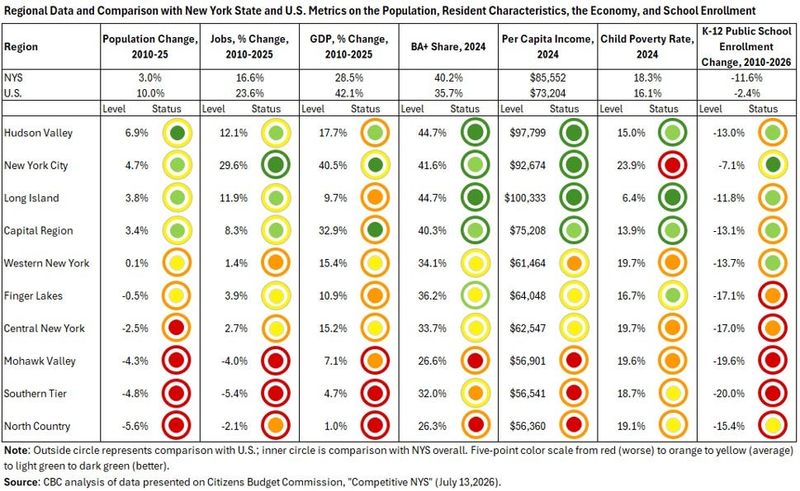
One chart included with the press release on the tracker’s release makes graphically clear the challenges facing the Mohawk Valley. The chart includes data for seven measures as well as color coding to show whether a region is below, above or tied with the national average and the state average for each measure.
The Mohawk Valley’s row on the chart is all orange and red, meaning it fares worse than both the state and national averages on all seven measures.
Those measures include: changes in population, jobs and gross domestic product between 2010 and 2025; the percentage of residents age 25 or older with bachelor’s or higher degrees, per capita income and the child poverty rate in 2024; and the change in public school enrollment from 2010 through this year.
Only the Southern Tier and the North Country show similar data, faring just slightly better with each tying the national or state average on two measures and faring worse on the rest.
More local response
But those statistics likely paint an overly gloomy picture of the Mohawk Valley since they’re based on data that’s one or two years old given how much investment and economic activity is currently taking place in the area, Barraco said.
He pointed to some numbers not included in the report:
“These investments reflect broader industry growth and expanding career opportunities across manufacturing, engineering, logistics, and plant operations,” Barraco said. “MVCC’s leadership of the ON-RAMP workforce training center in Utica will help connect local residents to these careers while supporting employers’ workforce needs.”
Acknowledging challenges is the first step to changing them
Kari Puleo, executive director of the Greater Utica Chamber of Commerce, also agreed that the dashboard data highlights challenges facing the Mohawk Valley, but noted that acknowledging challenges is the first step to addressing them.
“But this report is also arriving at an extraordinary moment for our community,” she said in a statement. “Semiconductor manufacturing investment at a scale the region has never seen before, a new hospital campus transforming downtown Utica, and a 40-year track record of successful refugee resettlement that stands as a national model for what smart immigration policy actually looks like on the ground.”
And she agreed with some of the policy conclusions the commission reached based on the data.
“The CBC is right that New York must loosen its grip on business regulation and spread its growth story beyond the downstate corridor,” she continued. “The Mohawk Valley is ready to be part of that story. The investment is here, the workforce pipeline is being built and the community is committed. We are asking Albany to meet us where we are.”
Local statistics
Here’s some specifics on the Mohawk Valley from the dashboard:
Solutions
The Citizens Budget Commission has formulated some public policy priorities for the state based on the data in its dashboard.
Here’s what it wants to see:
This article originally appeared on Observer-Dispatch: How competitive is the Mohawk Valley?
Reporting by Amy Neff Roth, Utica Observer Dispatch / Observer-Dispatch
USA TODAY Network via Reuters Connect
By Amy Neff Roth, Utica Observer Dispatch | USA TODAY Network